this post was submitted on 27 Apr 2024
692 points (97.9% liked)
Data Is Beautiful
6462 readers
1 users here now
A place to share and discuss data visualizations. #dataviz
(under new moderation as of 2024-01, please let me know if there are any changes you want to see!)
founded 3 years ago
MODERATORS
you are viewing a single comment's thread
view the rest of the comments
view the rest of the comments
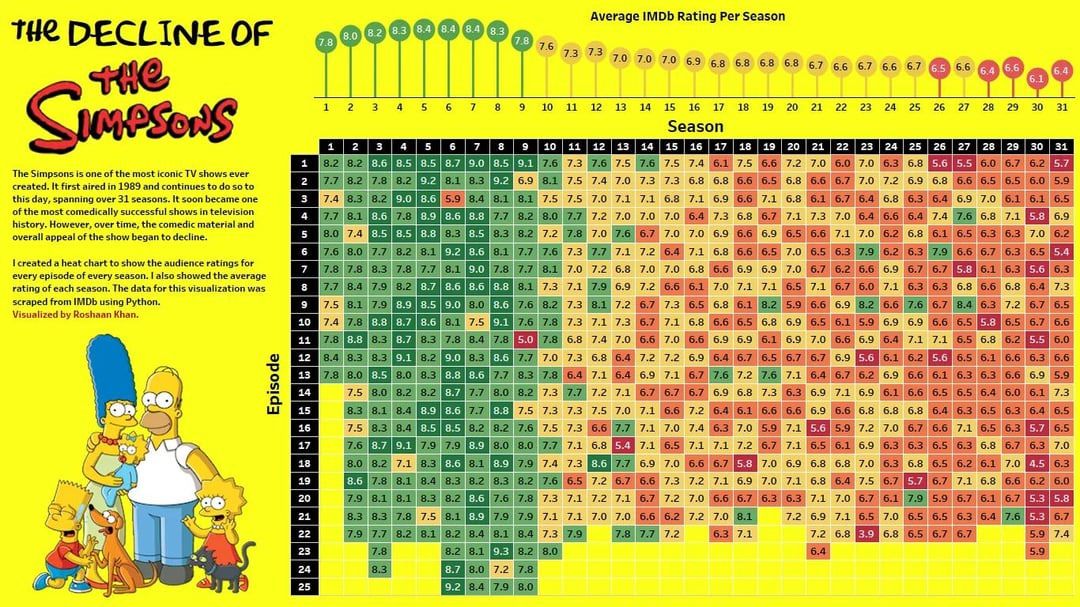
The graph represents my experience with The Simpsons. Back when they got their movie for the 10th anniversary, the serie was already struggling with the audience. I believe that was the point where they changed the animation to a horrible 3d rendering and, at least in my country, the started having troubles negotiating with the original voices we all grew up with.
Honestly at this point I believe I haven't missed much from the series since the 9th season. They should just let it die at this point, as they should've done it in 2007.
The movie came out in 2007, mate. Nothing to do with the 10th anniversary.
Also, you probably referred to the move from hand drawn to software animation. Because there is no "3d rendering" happening in the usual sense.
How an episode of The Simpsons is made: https://www.theverge.com/2015/10/25/9457247/the-simpsons-al-jean-interview
3d?
Some objects are 3d renders, most notably cars.